Returning from Tanzania’s geographically central but small capital city Dodoma to the coastal mega-city of Dar es Salaam, I reflected upon this slightly surreal experience. I was on board the only scheduled flight, a small 12 seater plane cruising at around 15,000 feet with little to do. My smartphone was struggling to pick-up mobile data from the ground network, so deprived of email I found a pre-downloaded Development Drums podcast to listen to, which turned out to feature the Global Centre for Development’s Owen Barder debating The Data Revolution with fellow ‘big thinkers’: Claire Melamed of the ODI and Amanda Glassman of the CGD.

Helping to drown out the drone of the propeller, Owen and his guests took me through a topic of increasing interest both to the development community and me personally, as I had worked on education data systems in developing countries for many years before joining DFID.
I’d recently visited Ethiopia’s northern Tigray region where I had mapped schools using GPS in the 1990’s, only later to discover that some of these very schools and communities became hotly disputed in the senseless Ethio-Eritirean border war that broke out soon after. It had made me realise some of the benefits of geo-data - lines and marks drawn on maps can lead to better service delivery planning as has been witnessed in Ethiopia with the huge increase in schooling.
UN Secretary-General Ban Ki-moon recently asked an expert advisory group to make concrete recommendations on bringing about a data revolution in sustainable development. DFID is increasingly interested in both the approach and objectives around data revolution and big data. This will inform the post 2015 development agenda with accurate and timely data (why did Nigeria’s GDP just double?), ensure that girls, disadvantaged and marginalised groups are not forgotten in statistical averages and empower citizens and stimulate innovation for growth.
New big data is also of interest in what the future may hold; we recently pondered mpesa money transfer flows in Tanzania estimated from phone network data and what this meant for economic and urban growth centres - when aggregated as big data, it helps to analyse economic flows in the country (that seemed mostly to bypass the capital Dodoma).
The podcast then raised some of the very topics I had just been debating with government, how to improve administrative data; in this case on education statistics collected mostly through government systems and how weak support and vested interests could distort information.
Tanzania uses the enrolment of students at a school to calculate operational grants. DFID and other developments partners utilise enrolment and teacher data to generate performance indicators linked to funding - if more equitable teacher deployment emerges. There are financial incentives linked to government improving equitable teacher distribution, by deploying more teachers to schools where there are shortages.
The CGD’s Justin Sandefur has reported on very similar such issues in Kenya and elsewhere in Africa. I tended to agree with Owen’s guests that there has been perhaps too much emphasis on sample surveys to estimate indicators around poverty and service delivery. More needs to be done both to improve detailed and timely government data in Africa and also to open the data up, through government websites and portals so anyone can challenge data presented, and merge and re-use it to add value and hold providers to account.
DFID is currently supporting work on both generating better administrative data on Tanzania’s schools, but also to open it up. We are encouraging Tanzania’s government staff to make good on their President’s commitment to the Open Government Partnership principles that embed Open Government.
I recently witnessed a brilliant data dive organised to assist the different government agency owners of statistics to cross index and merge huge data files about the country's 20,000 schools. GPS locations of schools were identified and new coding systems developed to help link information to a master list that we hope will soon go live with a geographic interface online. Government statisticians gained vital knowledge, not just in using a suite of modern open source analytical data and mapping tools, but in the huge potential benefits of collaboration.
Currently multiple annual publications are generated with single sources of data that are unwieldy to use in paper format, late to be issued, hard to acquire without written request letters and contain errors and inconsistencies if the ‘facts’ are only gently probed or triangulated. For example recent values of the primary net enrolment rate (a number of great relevance to MDG achievement) differs by more than 10%.
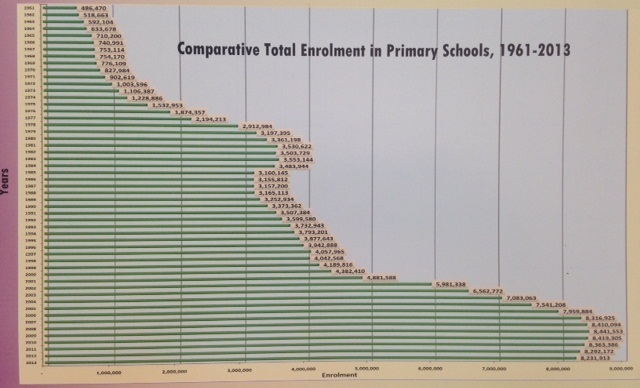
Tanzania undoubtedly has seen a great expansion of its school system as the chart of 50 years of administrative data shows - see the huge expansion from 2002, and the effect of the 2000 MDG declaration. However, it surely needs a revolution of better, open data to help set and achieve the next set of targets, which must do more than just count children, but assess how much they are actually attending school and learning something useful!
Keep in touch. Sign up for email updates from this blog, or follow Ian on Twitter.
Recent Comments